Is Pushing Your Speed Envelope Worth The Investment From Your Power Reserves When Racing...Or Wind Your Neck In If You Want To Run Well!
.PNG/v1/fill/w_320,h_320/file.jpg)
Cycling faster requires more power, but the relationship between speed and power is far from simple. As you increase your cycling speed, the power needed grows at a much faster rate than the speed itself. This happens because aerodynamic drag, the main force resisting a cyclist on flat terrain, increases roughly with the cube of speed. In practical terms, each extra kilometer per hour at higher speeds demands significantly more watts from the rider
This post explores how power requirements rise non-linearly with speed, why small power savings matter, and what this means for cyclists aiming to improve performance
How Power and Speed Relate in Cycling
When cycling on flat roads in calm air, two main forces resist your motion:
Rolling resistance: friction between tires and the road
Aerodynamic drag: air pushing against your body and bike
Rolling resistance increases linearly with speed, but aerodynamic drag increases exponentially, approximately with the cube of speed. This means that as you go faster, the air resistance grows dramatically, requiring much more power to maintain or increase speed
Power Increase for Each Additional 1 km/h
Here is a table showing the very approximate power needed for a typical solo rider weighing around 75 kg (rider plus bike), riding in a good road position with a drag coefficient area (CdA) of about 0.30 and rolling resistance coefficient (Crr) of 0.004. The table also shows how many extra watts are needed to increase speed by 1 km/h at various speeds
Speed (km/h) | Power (W) | Extra Watts for Next +1 km/h |
20 | 65 | +10 |
21 | 75 | +10 |
22 | 85 | +11 |
23 | 96 | +12 |
24 | 108 | +13 |
25 | 121 | +14 |
26 | 135 | +15 |
27 | 150 | +16 |
28 | 166 | +17 |
29 | 183 | +18 |
30 | 201 | +20 |
31 | 221 | +21 |
32 | 242 | +22 |
33 | 264 | +24 |
34 | 288 | +25 |
35 | 313 | +27 |
36 | 340 | +29 |
37 | 369 | +31 |
38 | 400 | +33 |
39 | 433 | +35 |
40 | 468 | +37 |
41 | 505 | +40 |
42 | 545 | +42 |
43 | 587 | +45 |
44 | 632 | +48 |
45 | 680 | — |
What This Means in Practice
Increasing speed from 20 to 21 km/h requires about 10 watts more
Going from 30 to 31 km/h needs roughly 20 watts more
From 35 to 36 km/h, the jump is about 29 watts
At 40 to 41 km/h, it takes around 40 watts extra
Between 44 and 45 km/h, nearly 50 watts more are needed
This shows that pushing for higher speeds demands disproportionately more power. The difference between 20 and 21 km/h is manageable, but the jump from 44 to 45 km/h is much harder
For triathletes or duathletes wanting a good run it's important to appreciate whether the physiological cost of increasing power to go faster is worth it when considering your whole race. If you're measuring just your effort and speed you may cross over into a higher physiological zone than you intended and that can be disasterous for the run Think on this:
A useful rule of thumb is:
20–25 km/h: roughly 10–15 W buys another 1 km/h
30–35 km/h: about 20–27 W per additional 1 km/h
35–40 km/h: about 30–40 W per additional 1 km/h
40–45 km/h: about 40–50 W per additional 1 km/h
45–50 km/h: 50–65 W per additional 1 km/h
So think on, at the pointy end of a bike leg, pushing to catch the riders in front, maintain a faster speed, or to overtake might 'only' mean pushing on by 2-4KPH, but the faster you are going the higher the watts required. It's all too easy to find yourself in a higher effort zone than you wanted physiologically, and that's going to hurt your run
For triathletes and time triallists, this is why aerodynamics become so valuable. Saving 20 W through position, clothing, helmet, wheels, or bike fit can produce the same increase in speed as gaining 20 W of FTP, often with far less training effort
The table below shows the impact of bike position on the watts required to hit a representative speed. Flat terrain, still air
Speed (km/h) | 55 kg Female Road Bike | 75 kg Male Road Bike | 90 kg Male Road Bike | 75 kg Male Road Drops | 75 kg Male TT Position |
25 | 105 | 121 | 135 | 112 | 96 |
30 | 175 | 201 | 223 | 185 | 155 |
35 | 273 | 313 | 346 | 286 | 239 |
40 | 408 | 468 | 515 | 424 | 347 |
45 | 592 | 680 | 745 | 610 | 490 |
50 | 838 | 962 | 1,050 | 853 | 678 |
The relative differences are striking:
Road bike, hoods → drops: saves around 10–12% of the required power.
Road bike → TT position: saves around 25–35%, with the saving increasing as speed rises.
55 kg vs 90 kg riders: at lower speeds the lighter rider benefits from lower rolling resistance, while at higher speeds aerodynamics dominate and body shape (CdA) becomes more important than weight.

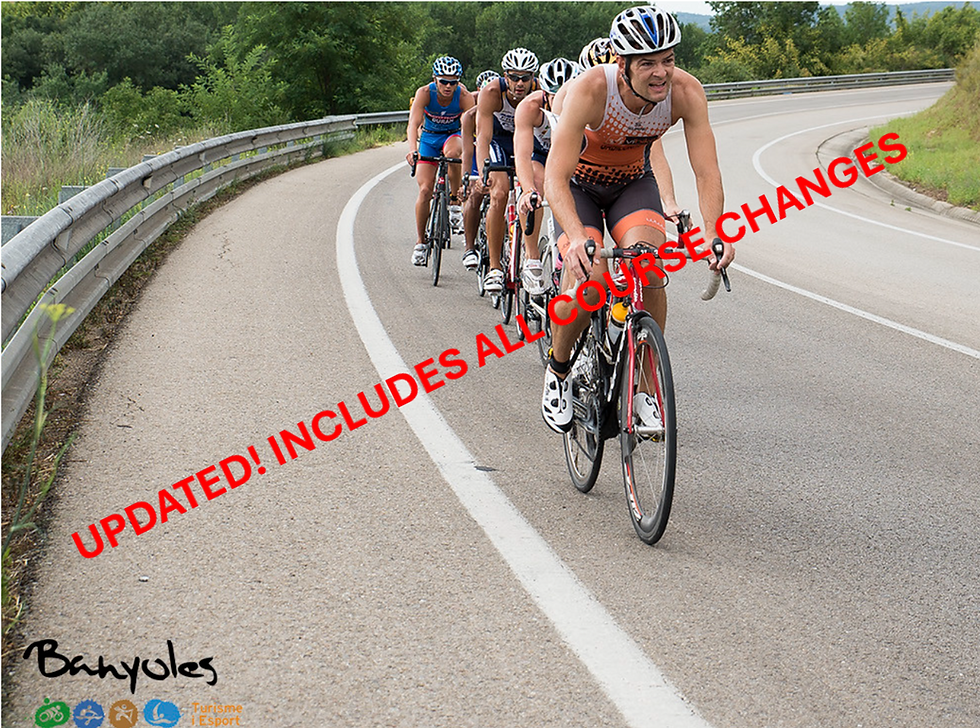
Image caption: A cyclist maintains a streamlined position on flat terrain to reduce aerodynamic drag and conserve power.
Why Aerodynamics Matter More at Higher Speeds
Because aerodynamic drag dominates power requirements at higher speeds, small improvements in aerodynamics can save significant watts. Elite cyclists spend a lot of time and money optimizing their position, clothing, and equipment to reduce drag.
Power Savings and Speed Gains
Saving 20 watts can translate into different speed gains depending on your current speed:
At 25 km/h, 20 watts extra power can increase speed by about 1.4 km/h.
At 35 km/h, the same 20 watts only add around 0.7 km/h.
At 45 km/h, 20 watts might increase speed by just 0.4 km/h.
This means that at higher speeds, every watt saved is more valuable because it can help maintain or slightly increase speed with less effort.
How to Use This Information to Improve Your Cycling
Understanding the non-linear power-speed relationship helps you make smarter training and equipment choices
Focus on aerodynamics: Improving your riding position, wearing tight-fitting clothing, and using aerodynamic gear can save watts and improve speed
Train for power: Building your ability to sustain higher watts lets you push through the steep power demands at higher speeds
Set realistic goals: Know that increasing speed by 1 km/h at high speeds requires much more effort than at low speeds
Use power meters: Track your watts to understand how changes in effort translate to speed gains
Race more smartly: now you know the true cost of those extra KPH decide in the race whether it's truly worth going into energy deficit and slowing your run
Equivalent speeds for the same power
Power | CdA 0.40 | CdA 0.35 | CdA 0.30 | CdA 0.25 | CdA 0.20 |
150 W | 25.4 | 26.5 | 27.8 | 29.3 | 31.2 |
200 W | 28.5 | 29.8 | 31.3 | 33.1 | 35.2 |
250 W | 31.0 | 32.5 | 34.2 | 36.2 | 38.5 |
300 W | 33.1 | 34.8 | 36.8 | 39.0 | 41.4 |
350 W | 34.9 | 36.7 | 38.8 | 41.2 | 43.8 |
400 W | 36.5 | 38.5 | 40.7 | 43.3 | 46.0 |
What athletes immediately notice
Suppose an athlete can sustain 300 W.
Improvement | Result |
Increase FTP to 320 W | ≈0.8–1.0 km/h faster |
Reduce CdA by 0.03 m² | ≈1.0 km/h faster |
Reduce CdA by 0.05 m² | ≈1.8 km/h faster |
Reduce CdA by 0.08 m² | ≈3 km/h faster |
That is why:
Professional bike fits can be worth several hundred pounds
Aero helmets frequently save 10–20 W
Tight-fitting tri suits save measurable power
Correct arm position can save 20–40 W
Wheel choice matters, but usually less than body position
Final Thoughts on Cycling Power and Speed
Cycling speed and power have a complex, non-linear relationship driven mainly by aerodynamic drag. Each additional kilometer per hour at higher speeds demands more watts than the last. This explains why elite cyclists invest heavily in aerodynamics and power training.
For recreational riders, understanding this relationship helps set realistic expectations and highlights the value of small improvements in position and equipment. For competitive cyclists, every watt saved or gained can make a meaningful difference in race performance.
If you want to ride faster, focus on both increasing your power output and reducing aerodynamic drag. The combination of these two factors will help you overcome the steep power demands that come with higher speeds.
Disclaimer: This post provides general information on cycling power and speed. Individual results may vary based on rider weight, position, equipment, and environmental conditions.


Great explanation. Thanks
Very thought-provoking 🤔